Encyclopedia

Solubility Diagram

The following article is from The Great Soviet Encyclopedia (1979). It might be outdated or ideologically biased.

Solubility Diagram


a graphic representation of the equilibrium composition of solutions as a function of temperature, pressure, or other parameter characterizing the external conditions.

The solubility diagram is a special type of phase diagram, the latter being widely used in chemical thermodynamics. A solubility diagram for a system made up of two partially miscible liquid components A and B, nitrobenzene and n-hexane, is shown in Figure 1. Each point a’ outside the shaded region corresponds to an unsaturated solution of one component in the other; each point on the curve bounding this region represents a saturated solution; and each point inside the shaded region corresponds to a two-phase system from the layer of the saturated solution of A in B, whose composition is denoted by point b, and from the layer of the saturated solution of B in A, whose composition is denoted by point c.

Figure 1

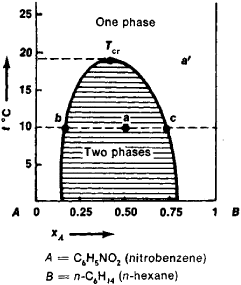
Complete miscibility occurs in many systems at temperatures above a certain TCT —the critical solution temperature. The compositions of both layers are identical at this temperature. If the curve bounding the two-phase region has a maximum, TCT is called the upper critical solution temperature (Figure 1); if it has a minimum, it is called the lower critical solution temperature. The solubility diagrams for certain systems, for example, water-nicotine, contain both critical temperatures.

The Great Soviet Encyclopedia, 3rd Edition (1970-1979). © 2010 The Gale Group, Inc. All rights reserved.
Mentioned in
References in periodicals archive
The solubility of fenofibrate in every HP[beta]CD solution was calculated and a phase solubility diagram was drawn between solubility of fenofibrate and different concentrations of HP[beta]CD.
The apparent stability constants, [K.sub.1:1], obtained from the slope of the linear phase solubility diagram was 630.0006 [M.sup.-1] for HP[beta]CD [Eq.
According to the model presented by Higuchi et al the phase solubility diagram of QpE belongs to AL type suggesting that the inclusion complex was formed with a molar ratio of 1:1.
The apparent stability constant, Ks, was calculated from the phase solubility diagram with the assumption of 1: 1 stoichiometry, according to (1):
As can be seen, it shows AL-type solubility diagram as the pyrimethanil solubility increases with increasing HP-[beta]-CD concentrations, according to the classification established by Higuchi and Connors [19].
SAP solubility diagram. In this plot, data points more tightly cluster around the solubility (or observed constant IAP in the case of AlOHS[O.sub.4]) lines, as the plot accounts for more variables than the Al activity v.
Solubility diagrams were constructed using the equations for amorphous aluminium hydroxide, alunite, and AlOHS[O.sub.4] plus equations and p[K.sup.0] values from the literature for alunogen (Nordstrom 1982) and basaluminite (Adams and Rawajfih 1977).
The stoichiometry of pesticide-cyclodextrin complexes and their stability or binding constants are frequently obtained from the phase solubility diagrams. These phase solubility studies were performed by the method reported by Higuchi and Connors [19].
The phase solubility diagrams were obtained plotting the equilibrium concentrations of terbuthylazine against the concentration of the respective CD.
The apparent stability constants, [K.sub.s], were calculated from phase solubility diagrams with the assumption of 1:1 stoichiometry, according to the following equation:
Copyright © 2003-2025 Farlex, Inc Disclaimer
All content on this website, including dictionary, thesaurus, literature, geography, and other reference data is for informational purposes only. This information should not be considered complete, up to date, and is not intended to be used in place of a visit, consultation, or advice of a legal, medical, or any other professional.