constant-pressure chart
[¦kän·stənt ¦presh·ər ‚chärt] (meteorology)
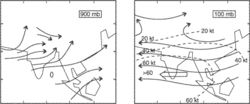
The synoptic chart for any constant-pressure surface, usually containing plotted data and analyses of the distribution of height of the surface, wind temperature, humidity, and so on. Also known as isobaric chart; isobaric contour chart.
McGraw-Hill Dictionary of Scientific & Technical Terms, 6E, Copyright © 2003 by The McGraw-Hill Companies, Inc.
constant-pressure chart
An Illustrated Dictionary of Aviation Copyright © 2005 by The McGraw-Hill Companies, Inc. All rights reserved