histogram
[′his·tə‚gram])
histogram
a diagrammatic representation of a FREQUENCY DISTRIBUTION, consisting of contiguous rectangles displaying interval-level data (see CRITERIA AND LEVELS OF MEASUREMENT) grouped into categories. In a histogram the width of the rectangle is proportional to the class interval under consideration, and the height is the associated frequency. The area of each bar is then proportional to the frequencies for each class interval (see Fig. 13). A histogram differs from a BAR CHART in that it is the areas of the rectangles which represent the relative frequencies.histogram
A bar graph that uses the width of the bars to represent the various classes and the height of the bars to represent their relative frequencies.Camera Histograms
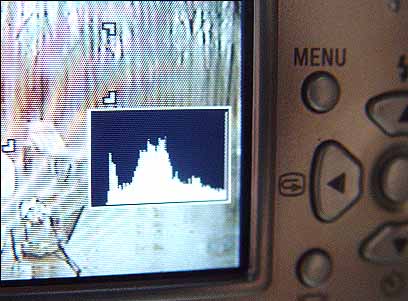
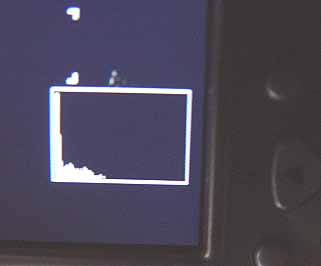
Digital camera histograms show the image's overall exposure. Using 256 vertical bars to represent brightness levels from 0 to 255, the leftmost bar is the darkest pixel level (0), and the rightmost bar is the lightest (255). The height of the bars represents the total number of pixels at that brightness level.
What is of most interest to the photographer is how the bars spread horizontally from left to right. For example, if there are no bars on the left, there are no black pixels in the image.
 |
| Light Pixels |
|---|
| Histograms appear on the same LCD screen used to preview the image. In this daylight example, there is an absence of dark shadows because the histogram shows no pixels on the left side (dark side). |
 |
| Dark Pixels |
|---|
| In this example, the camera was pointed into a totally dark room, and the bars are confined entirely to the leftmost side (dark side). |
Histogram
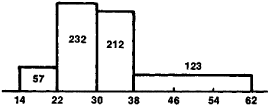
a column diagram, a type of graphical representation of the statistical distributions of some quantities in quantitative terms. A histogram represents a set of contiguous rectangles constructed on a straight line. The area of each rectangle is proportional to the frequency with which the given quantity is found in the set being studied. For instance, let the measurement of the trunk diameters of 624 pine trees produce the following results:
| Diameter (cm)............... | 14-22 | 22-30 | 30-38 | 38-62 |
| No. of trunks | 57 | 232 | 212 | 123 |
The limits of the groups into which the trunks are divided by diameter are plotted along the horizontal axis, and on the segment corresponding to each group, a rectangle having an area proportional to the number of trunks within the given group is constructed as if on a foundation (Figure 1).
The granulometric composition of rocks is often depicted in the form of a histogram. In this case the percent content of the obtained groups of particles of so-called fractions is plotted on the vertical axis and the logarithms of their limiting
size are plotted on the horizontal axis (Figure 2). The use of logarithms is necessitated by the fact that in granulometric analysis, the particles are subdivided into fractions whose size diminishes in a geometric progression. Histograms are
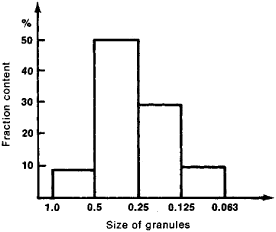
occasionally constructed on arbitrarily chosen equal segments, regardless of the difference in the limiting size of the fractions. Then the heights of the columns are proportional to the content of the fraction sizes.