)
Hertzsprung–Russell diagram
(rus -ĕl) (H-R diagram) A two-dimensional graph that demonstrates the correlation between spectral type (and hence temperature) and luminosity of stars, discovered independently by the Danish astronomer E. Hertzsprung in 1911 and the American astronomer H.N. Russell in 1913. Instead of a uniform distribution, any large sample of stars is found to form well-defined groups or bands on the graph of spectral type plotted against absolute visual magnitude: about 90% lie along a diagonal band known as the main sequence; the somewhat brighter giant stars form another sequence as do the very brightest and relatively rare supergiants; white dwarfs and other groupings can also be distinguished.There are several forms of H-R diagram. In most observational applications the absolute visual magnitude, M V, is the vertical axis and the color index, B –V , the horizontal axis, color index being related to but more easily measured than spectral type. These are color-magnitude H-R diagrams. When studying a cluster, whose stars are all at the same distance, apparent rather than absolute magnitude is used. Other studies use bolometric magnitude against effective temperature – theoretical H-R diagrams – or luminosity against color index – color-luminosity H-R diagrams.
The H-R diagram is of great importance in studies of stellar evolution. Diagrams obtained on the basis of theoretical calculations can be tested against observationally determined diagrams. They can be drawn for the brightest stars (see illustration), for stars in a particular locality such as the solar neighborhood (mainly small cool main-sequence stars), for pulsating variables, for globular clusters, etc. The two broad stellar populations – populations I and II – can be demonstrated by the H-R diagrams of a young open cluster (no giants), a somewhat older open cluster (a few giants), and a much older globular cluster (many giants and supergiants).
The H-R diagram can also be used for distance determination by both main-sequence fitting for stellar clusters and by spectroscopic parallax for individual main-sequence stars, the star's spectral type fixing its position on the diagram and thus indicating its absolute magnitude and hence its distance modulus.
Hertzsprung-Russell diagram
[′hert·spru̇ŋ ′rəs·əl ′dī·ə‚gram]Hertzsprung-Russell Diagram
(also color-luminosity array), a diagram of the relationship between the spectral class (or surface temperature) and absolute magnitude (or logarithm of luminosity) of stars, which allows conclusions to be drawn about the nature and development of stars.
The Hertzsprung-Russell diagram (H-R diagram) is named after E. Hertzsprung, who first discovered the above relationship, and H. Russell, who studied it in detail. The H-R diagram is a distinctive diagram of the state of stars, as a result of which stars with similar physical characteristics form in it more or less isolated groups, characterizing the initial conditions and subsequent stages of stellar evolution.
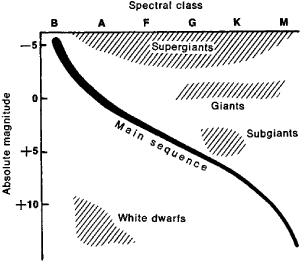
The majority of known stars are situated along the main sequence (see Figures l and 2), which extends in a diagonal in the H-R diagram from hot blue stars (for example, Spica; spectral class B) with a luminosity 1,000 times the sun’s through white stars (Sirius; A), yellowish-white (Procyon; F), yellow (the sun; G), and orange (τ Ceti; K) to the red dwarfs (the star Kruger 60; M), which are 1,000 times fainter than the sun. The giant stars—yellow, orange, and red ones of large dimensions (Capella, Arcturus, Aldebaran)—are located to the right of the main sequence. The supergiants—a relatively small group of stars of all spectral classes with very great luminosity (104-105 times greater than the sun’s)—fill the uppermost region of the H-R diagram (Rigel; B and Betelgeuse; M). Subgiants are the reddish stars whose dimensions are greater than those of stars in the main sequence with the same luminosity (components of eclipsing binary stars). Subdwarfs are dwarfs in the main sequence that are
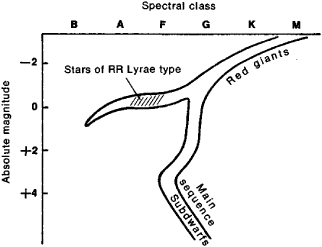
distinguished by a lower content of metals, which is characteristic of Population II stars, and that are situated as a result of this in the H-R diagram within the main sequence. (Originally it was believed that subdwarfs form a separate sequence 1-1.5 magnitudes below the main sequence.) A group of white dwarfs—very dense small stars—is 10 magnitudes below the main sequence.
Each group of stars is characterized by certain relationships between mass, luminosity, and radius and by its own structural features. The number of stars in the H-R diagram varies from region to region; there are far fewer stars of great luminosity than faint stars. There are virtually no stars outside the groups described above. Figures 1 and 2 show H-R diagrams for stars in the vicinity of the sun and stars in open, loose clusters belonging to the flat component of our galaxy (Figure 1) and stars in globular clusters belonging to the spherical component of our galaxy (Figure 2). The difference in the diagrams (the absence of supergiants in the upper part of the main sequence among Population II stars) is attributable to the difference in age (that is, in the observable stages of evolution) and in the initial chemical composition of the two populations. (Population II stars are mostly older and contain fewer metals.)
A. G. MASEVICH